Introduction
Every day, we come across different kinds of numerical data in TV, newspapers, magazines, and social media. Data are units of information. It may be numeric or textual.
For data to be meaningful and useful, the items of the data must be gathered and recorded in a systematic manner. This is referred to as data handling.
Do you know why we need data handling? Watch the video below:
Concepts
The chapter ‘Data Handling’ covers the following concepts:
Collecting and Organizing Data
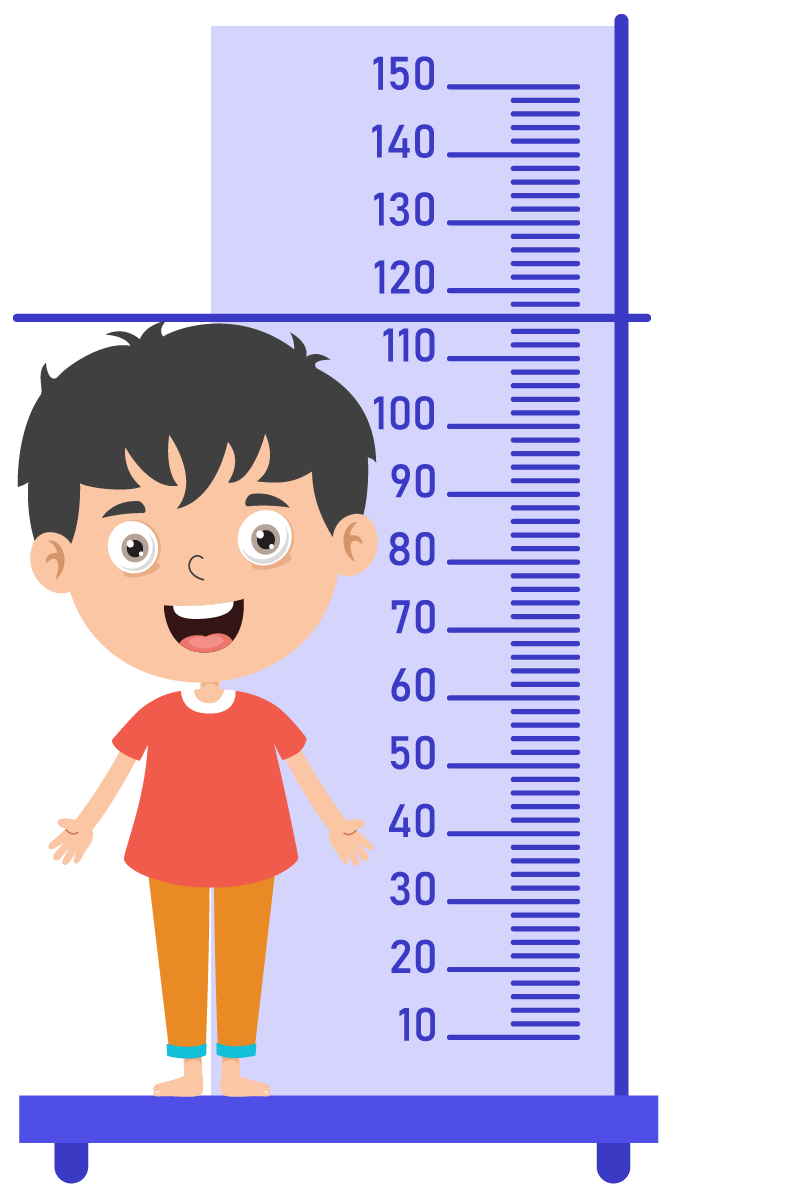
Data is a collection of facts, such as numbers, words, measurements, observations or just descriptions of things. For example, the heights of children in your class.
Data can also be marks of all the students in a subject, the number of tourists who visited a place, the number of children who like sports, etc.
It is important to organize the data as it helps in better understanding and interpretation of the data.
Suppose you have data on the results of 10,000 students in a school and you need to find out how many students scored a percentage greater than 90.
If your data is unorganised, it will take a lot of time and resources to gather the required information but if you have organised the data in descending order of percentages, then it will be very quick and easy to sort out the required information.
Hence, organising data helps in many ways such as:
- It decreases the time consumed to search for data.
- It helps in reducing data loss and reduces errors.
- It also helps you to understand why the data was collected and what the proper use of it is.
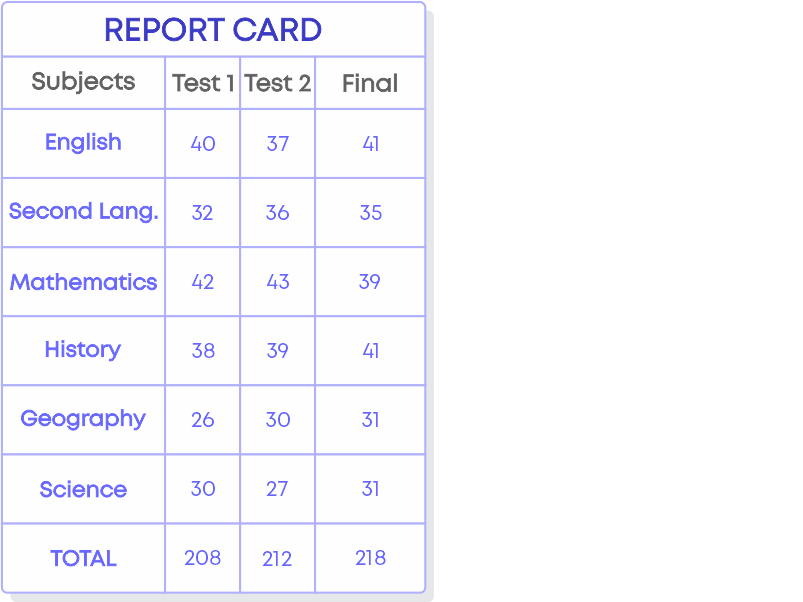
Have you seen data organised in the form of a table? What about the marks in your report card or a bill of something you purchased?
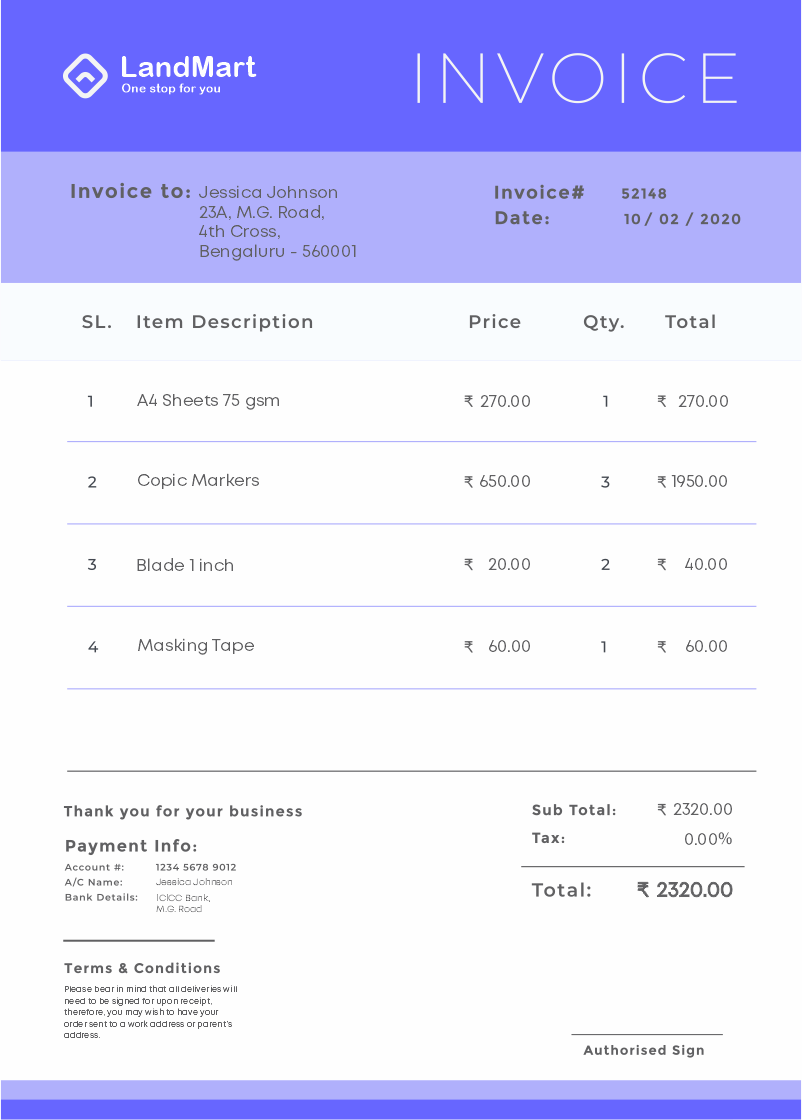

The data is organised in a table. Organising data in a table is called tabular form.
We see that when the report card is organised in the tabular form it is easier for us to get the information. How about if the report card is given in the form below?
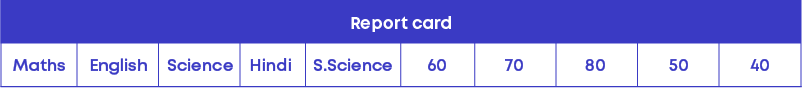
It is very difficult to get information from such report card where maximum and minimum marks are not given and the information given is not organised.
After collecting the data, we need to organise it in a table so that it becomes easier to understand and interpret. Let us understand how to organise the data.
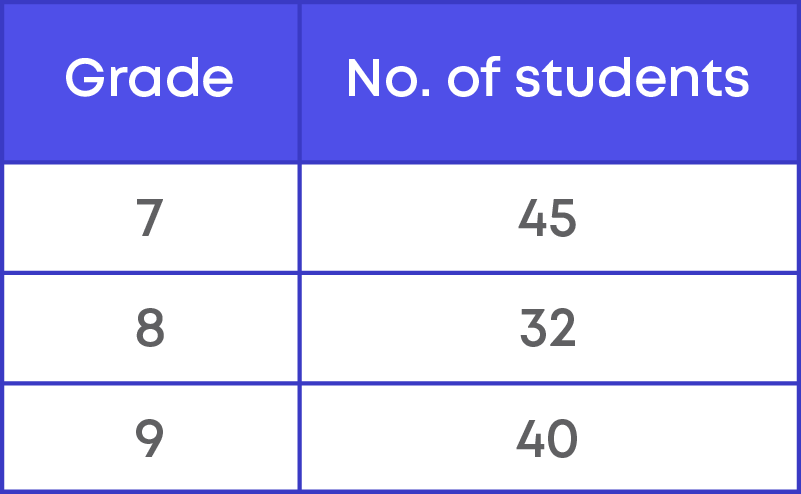
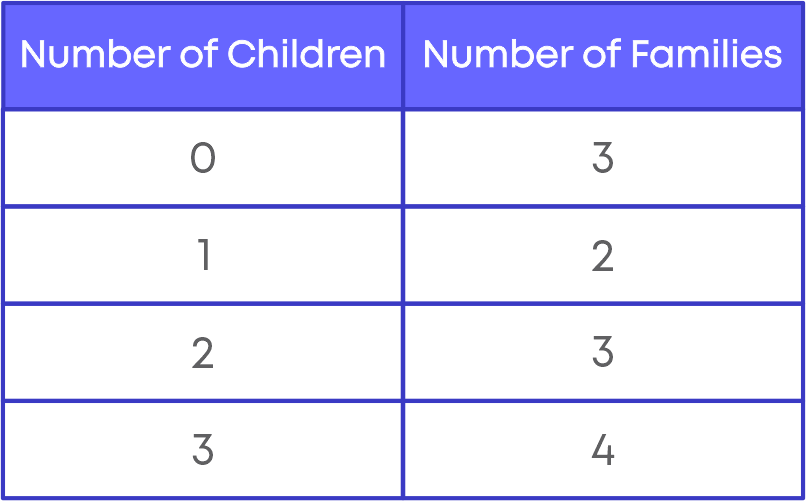
Given below is the data showing the number of children in 12 families.
3, 1, 3, 2, 3, 1, 0, 0, 2, 3, 2, 0
Now, let us arrange this data in a tabular form. Here, the information is about the number of children in the 12 families.
Hence, we need to have two columns:
- Number of children
- Number of families
Let us organise the given data in the table.
It becomes easy to understand and interpret when we organise the data. It can be in tabular form or other forms as well.
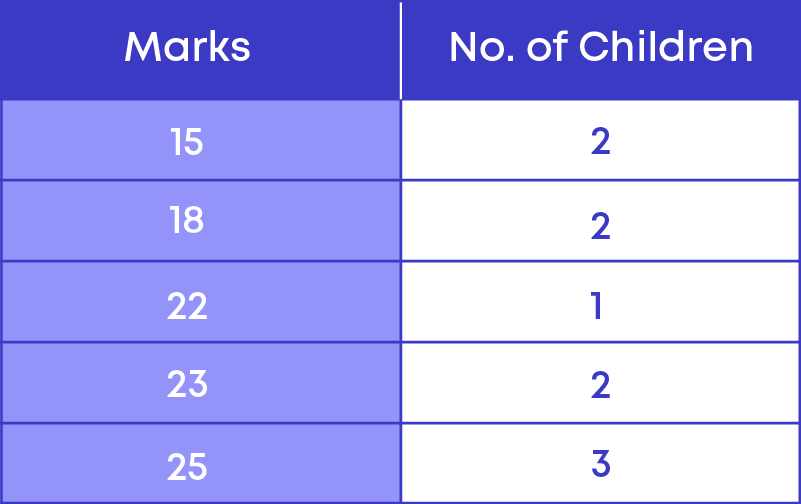
From the table above, we can understand that there are,
- 3 families with 0 children (0 children means no child)
- 2 families with 1 child each
- 3 families with 2 children each
The number of times a data/observation occurs in a data set is known as its frequency. The tabular arrangement of data which shows the frequency of each observation in a data set is known as the frequency distribution.
The teacher is conducting an election for the class representative. The candidates are Manoj, Asha, Riyaz and Gunjan. There are 25 children in the class and each one wrote the name of their favourite person in the book. The raw data is as follows:
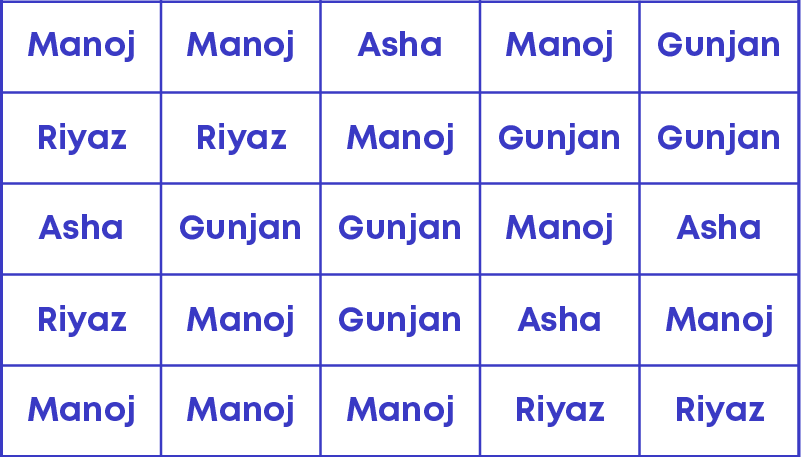
By looking at this data can you say who the winner is? No! It will be time-consuming. Let us show the data in a different way.
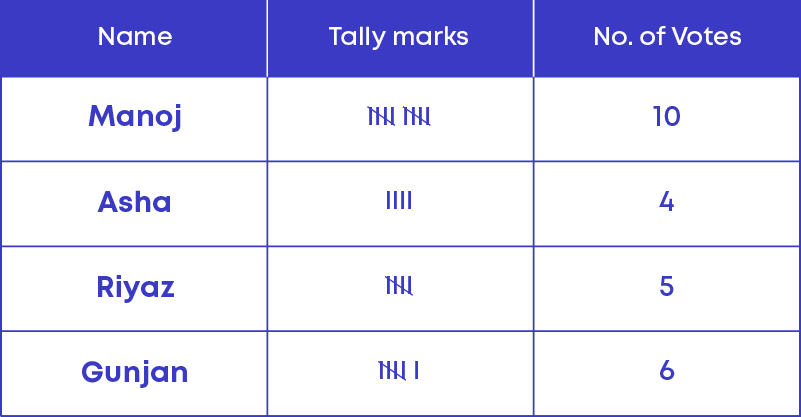
Form a table with three columns.
- Name
- Tally marks
- Number of votes
Draw tally marks. For each name in the raw data, start drawing tally marks against the corresponding row in the table. The resulting table is as given below.
We follow these 3 simple steps to prepare a frequency table:
Step 1: Arrange the given data in ascending/descending order.
Step 2: Identify the columns to prepare the frequency distribution table.
Step 3: Count the frequency of each value in the set of data and prepare the frequency distribution table.
Representative Values
A representative value is a single value, which gives the centre value or central tendency of the data set. We can get the centre or middle of the data set using a representative value. It aims to provide an accurate description of the entire data in the distribution.
There are 3 representative values:
- Mean or Average or Arithmetic mean
- Median
- Mode
Arithmetic Mean
The arithmetic mean or average gives a very good idea about the central value of the numerical data collected. As a single value, it gives information about the data set.
The arithmetic mean is a value of a data set that helps us to compare and assess the performance of an individual over the others.
We know that an average is a number that represents or shows the central tendency of a group of observations or data.
Since average lies between the highest and the lowest value of the given data so, we say the average is a measure of the central tendency of the group of data. It is also called as 'mean' or 'arithmetic mean.'
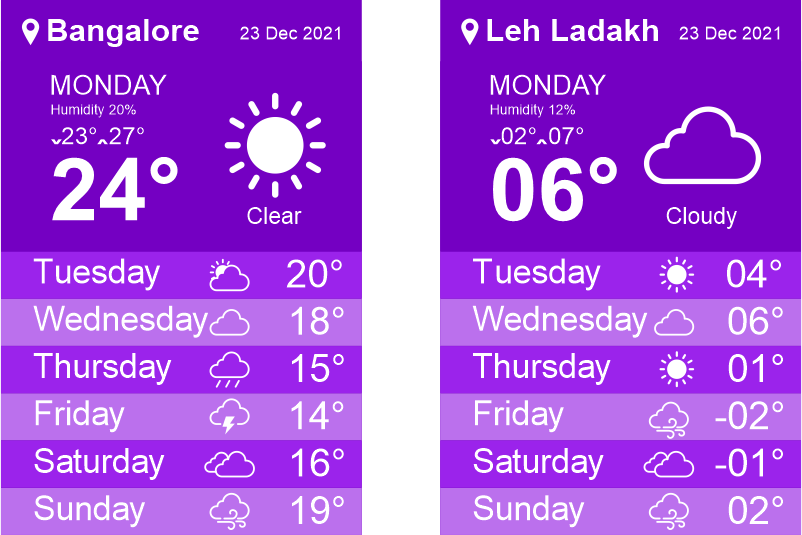
The average temperature of a city in January 2020 is 24-degree Celsius.
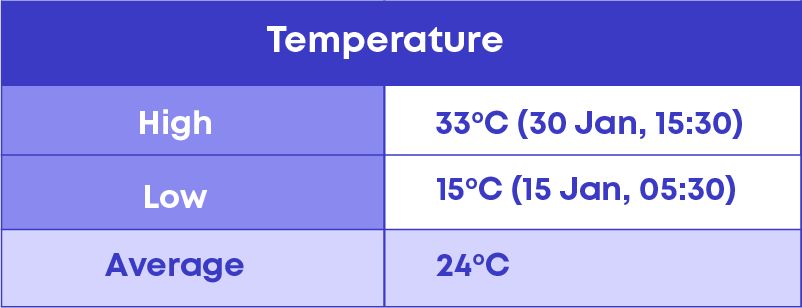
Looking at the mean temperature, we infer that very often the temperature is around 24 °C. Sometimes it may be less than 24°C or more than 24°C. We use the arithmetic mean to infer the average temperature.
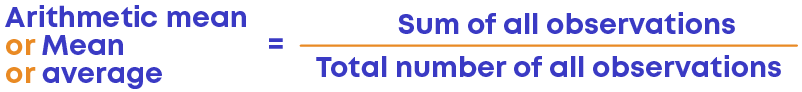
We calculate average/mean/arithmetic mean as,
“Average” is used in many situations in our day-to-day life. Some of them are as follows:
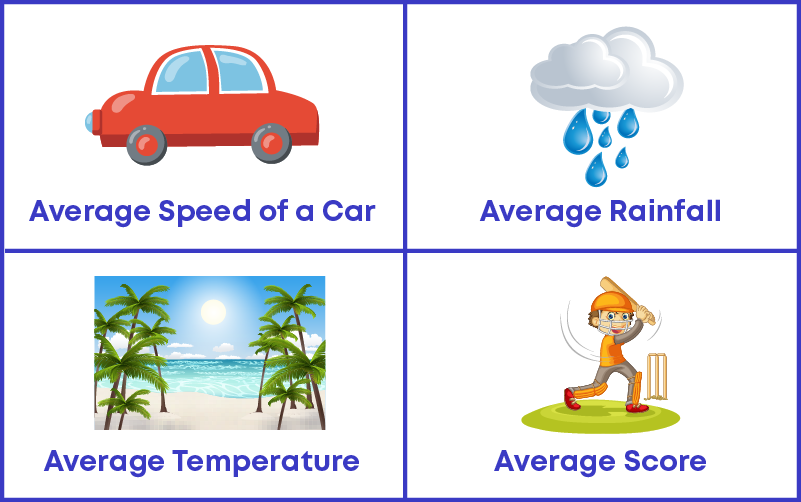
“Average” is one of the representative values used to understand a set of data. Average is also called as mean or arithmetic mean.
Tarun is analysing the number of matches won by his favourite team in the last 8 IPL seasons.
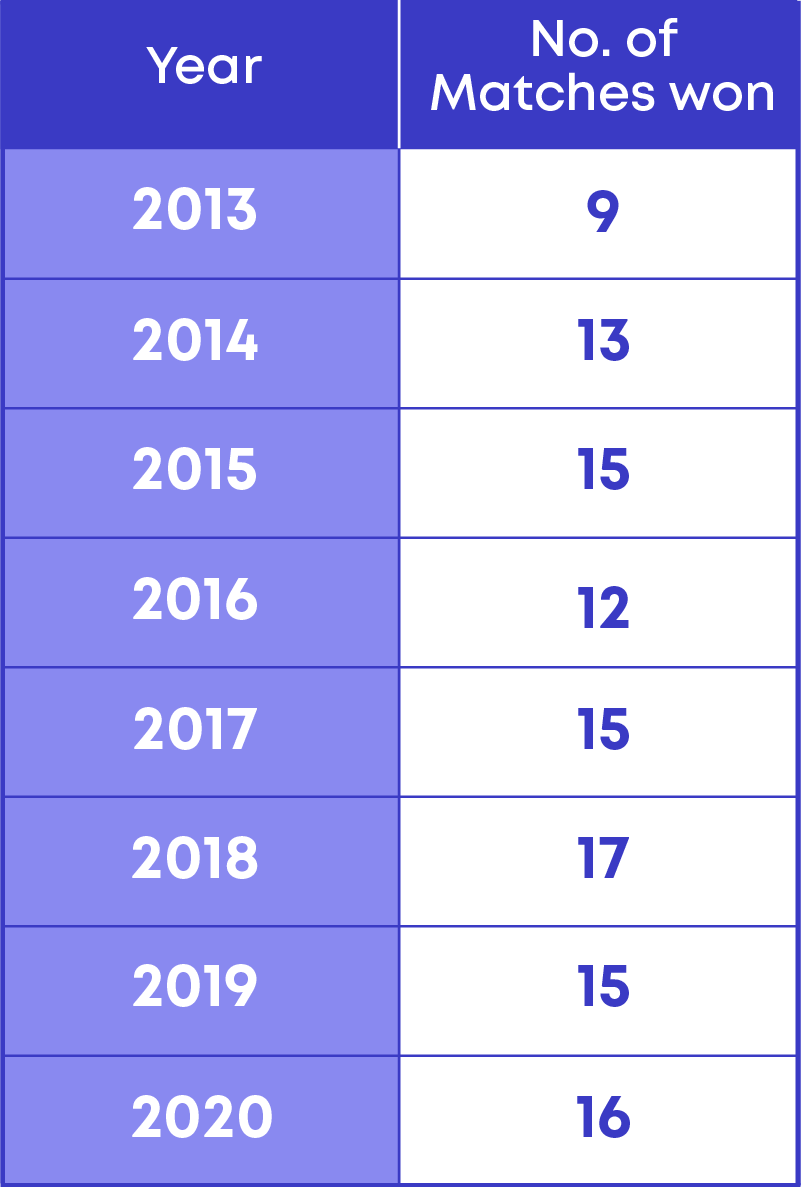
He wants to calculate the mean or average number of matches that his favourite team wins. We
know that mean = sum of all observations / total observations.
Hence, mean = total number of matches won / total number of seasons
Let us now calculate the average number of matches won.
- The total number of matches won = 112
- The total number of seasons = 8
Mean = 112/8 = 14
Hence, the mean or average number of matches won = 14 matches.
Properties of arithmetic mean/average:
- It is not necessary that the mean is a member of the given data.
- The mean of the given data lies between the highest and lowest observations.
We use the arithmetic mean formula to solve different types of problems. Based on the type of the problem, the strategy to solve it will differ.
Type 1: Find a missing observation.
To solve such problems, follow this strategy:
- Find the sum of the observations.
- Subtract the sum of the given observations (excluding the missing value) from the sum of total number of observations.
Type 2: Find the total number of observations.
To solve such problems, follow this strategy:
- Divide the sum of all the observations by the mean.
Type 3: Find the sum of all observations.
To solve such problems, follow this strategy:
- Multiply the total number of observations by the mean.
Now, let us consider the data of marks obtained by different students.
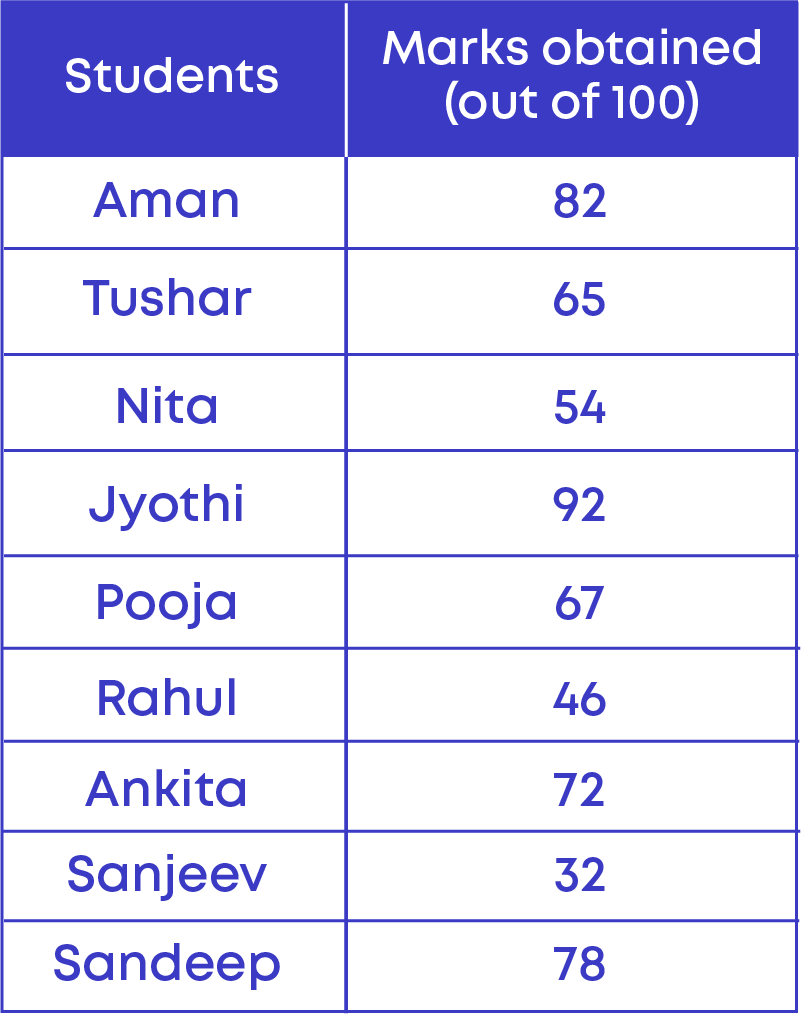
From the given table we can see that,
- Highest marks in the data = 92
- Lowest marks in the data = 32
The difference between highest and lowest marks
= 92 – 32 = 60
60 is known as the ‘Range’ of this data. The range is the difference between the highest and lowest value of data in a set.
It is the spread of the values - in other words, it is the interval in which the values tend to lie.
Mode
The mode is the observation that occurs most frequently in the data. In other words, the mode has the highest frequency in the given data.
Pranav wants to start a business selling shirts. So, he went to buy shirts from a manufacturer. He asked the manufacturer about which size of the shirts were sold the most. So, the manufacturer showed him the data of the sizes of shirts he sold in a week.
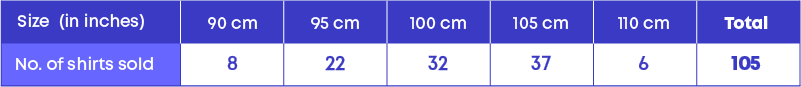
Here, we can observe that 105 cm size shirts were being sold the most.
Hence, the size 105 cm is known as the mode of the given data. So, while ordering the shirts, he ordered a greater number of shirts of size 105 cm. This is how mode helps us in daily life.
Let us understand the properties of the representative value ‘mode’.
- Mode is one of the observations from the data set.
- There can be more than one mode in a data set.
- There can be no mode in a data set.
To find the mode of numerical data set, first arrange the numbers in ascending or descending order, then find the mode.
We follow these two simple steps to calculate the mode of large data using a tally marks table:
- Step 1: Make a table and record the observations and their frequencies using tally marks.
- Step 2: Whichever observation has the highest number of tally bars/marks will be the mode.
Median
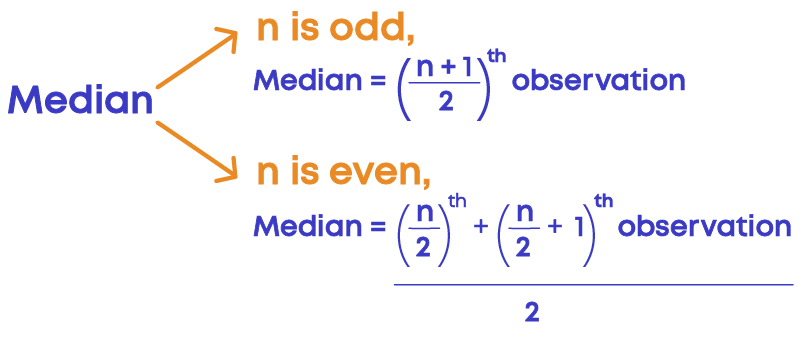
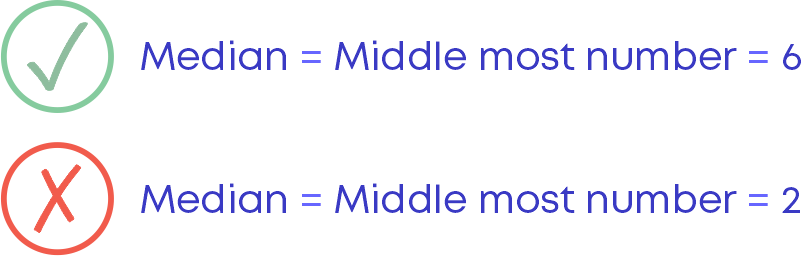
When some given data is arranged in ascending (or descending) order, then the middlemost observation is the median of the data.
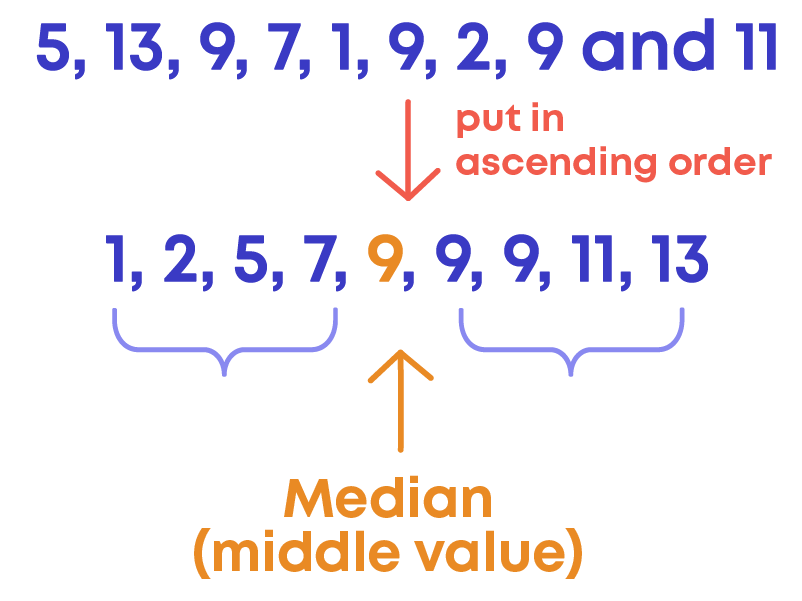
- When a given data set has an odd number of observations, the middle number becomes the median.
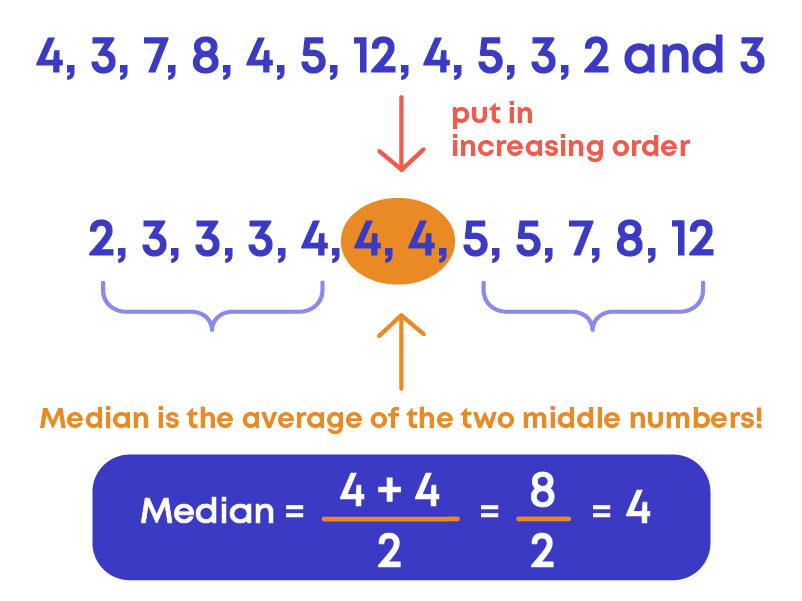
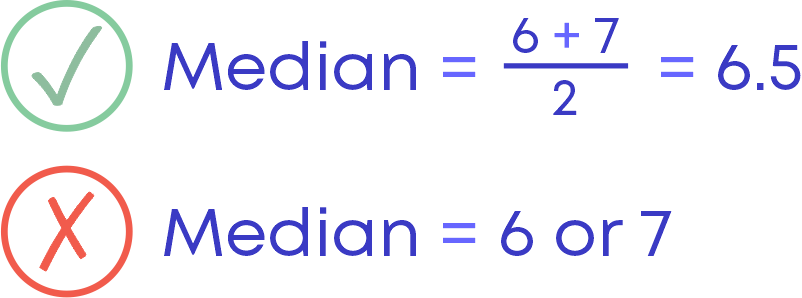
- When a given data set has even number of observations, the median will be the average of the middle two numbers.
The median is the middle point of a number set, in which half the numbers are above the median and half are below. Median divide the data into two equal groups so that we know which group has lower values and which set has higher values in a data set.
The formula to calculate the median of the data set is given as follows:
Examples:
When data is odd:
When data is even:
Properties of median:
- It is not necessary that the median is a member of the given data.
- The median of the given data lies between the highest and lowest observations.
By now, we know how to calculate mean, median and mode. They give us a measure of Central Tendency (i.e. where the centre of our data falls). So how do we know when to use mean, median, and mode?
Mean is the most used representative value. Median gives a better interpretation of the data set when there are outliers in the data set. We calculate mode in situations such as, favourite cereal, favourite colour, what brand of shoes are popular, etc.
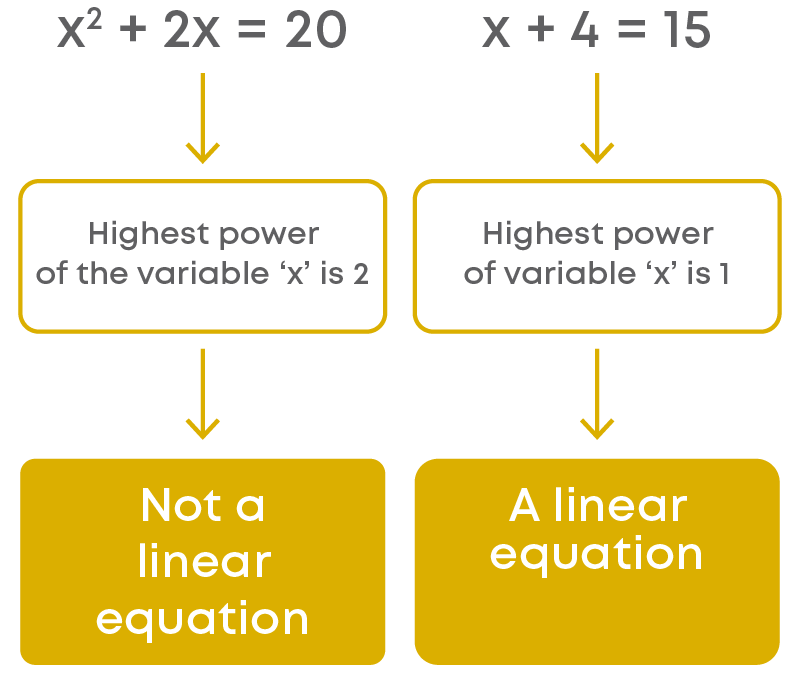
Bar Graph
A bar graph is the representation of numerical data using rectangles (or bars) of equal width and varying heights. They are also known as bar charts.
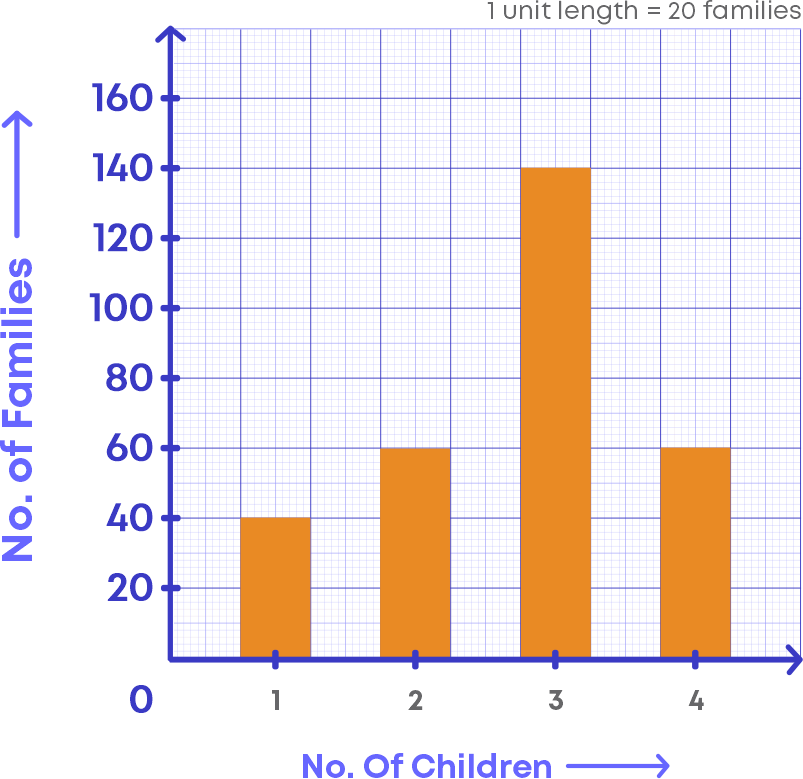
Let us examine the bar graph and understand its elements
- The horizontal line in which the “Number of children” is labelled.
- The vertical line in which the “Number of families” is labelled.
- Scale, which shows how each unit of the vertical line is defined or scale is the number used to represent one unit length of a bar.
- Bar graphs can be horizontal or vertical.
Let us understand more about the scale of the bar graph.
- In the bar graph above, look at the vertical line, you can see that the numbers are written as multiples of 20.
- This is because the scale of the bar graph says that each unit in the vertical line is defined to be 20 families
You know that scale is an important element of a bar graph. It is important to choose the scale of the graph so that the given data set should be plottable on graph paper.
- If the data set has values of larger magnitude like 100, 200, … etc, we increase the value of the scale.
- If the data set has values of smaller magnitude like 2, 4, 6, … etc, we decrease the value of the scale.
Let us take a bar graph depicting the number of items sold during a week in a shop.
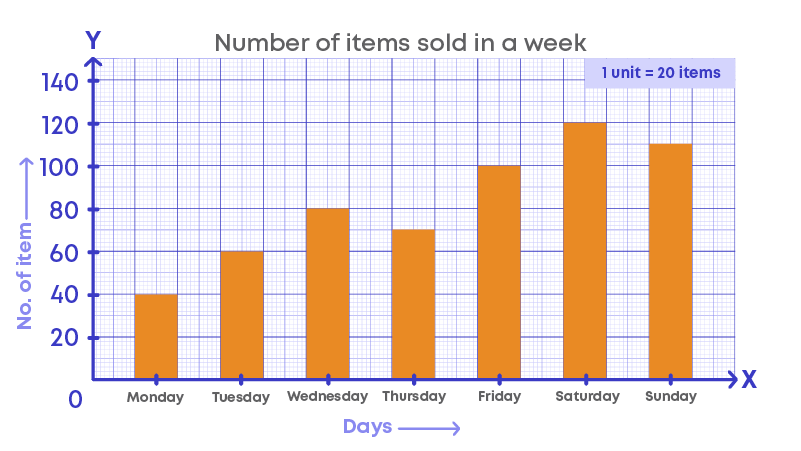
- In a bar graph, the title tells us what the graph represents. The above graph represents the number of items sold in a week.
- The height of the bar represents the values in numbers. Here, the scale is 1 unit = 20 items.
- If the height of the bar is 4 units, then the value of the bar is 80 items.
- If the height of the bar is maximum, then it indicates the highest number of items sold on that day.
- If the bar is shortest, then the number of items sold on that day is the least.
The shop sold:
- 40 items on Monday
- 60 items on Tuesday
- 80 items on Wednesday
- 70 items on Thursday
- 100 items on Friday
- 120 items on Saturday
- 110 items on Sunday.
Hence, the total number of items sold will be 580.
To interpret a bar graph, follow these steps.
- Understand what the graph represents by looking at the horizontal and vertical lines.
- Check the scale of the graph.
- The height of the bar represents the data for that category.
- Use this information to interpret the graph.
To draw a bar graph for given data, follow the steps below:
- Step 1: Mark a reference point O on the graph paper, then from O draw a vertical line OY and horizontal line OX.
- Step 2: Mark the points on the horizontal line.
- Step 3: Choose a suitable scale.
- Step 4: Determine the heights of each of the bars from the given data and draw the bars.
A double bar graph is used to display two sets of data on the same graph. The bars can be arranged vertically or horizontally.
For example, if you wanted to show the number of vegetables that Maria grew in July compared to August, we would use a double bar graph. The following double bar graph compares vegetables grown in July and August.
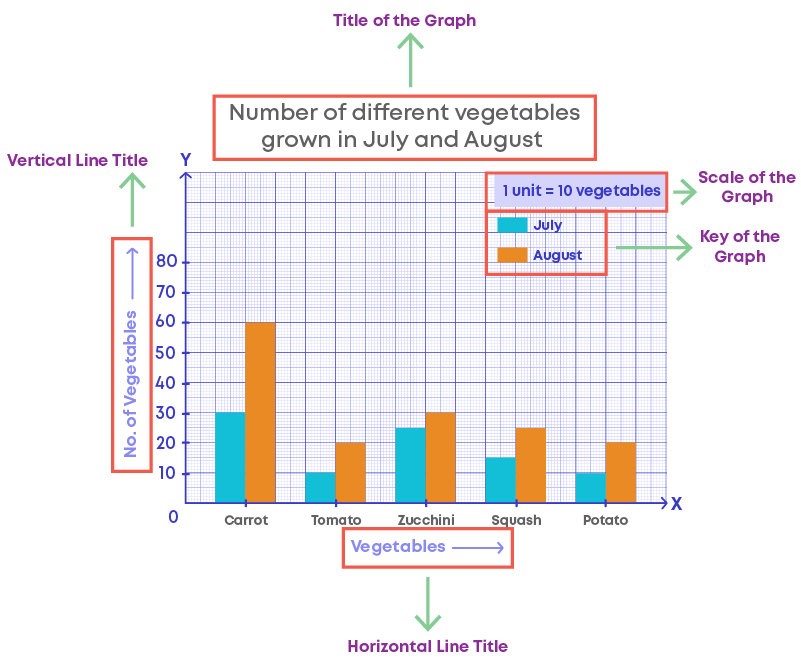
Let us examine the double bar graph and understand its elements.
- The horizontal line in which the “Vegetables” is labelled.
- The vertical line in which the “Number of vegetables” is labelled.
- Scale, which shows how each unit of the vertical line is defined. Scale is the number used to represent one unit length of a bar.
- The key for a double bar graph will represent the two data sets being compared with two separate colours.
- From the key, we can understand that orange bars represent the different vegetables grown in the month of August and blue bars represent the different vegetables grown in the month of July.
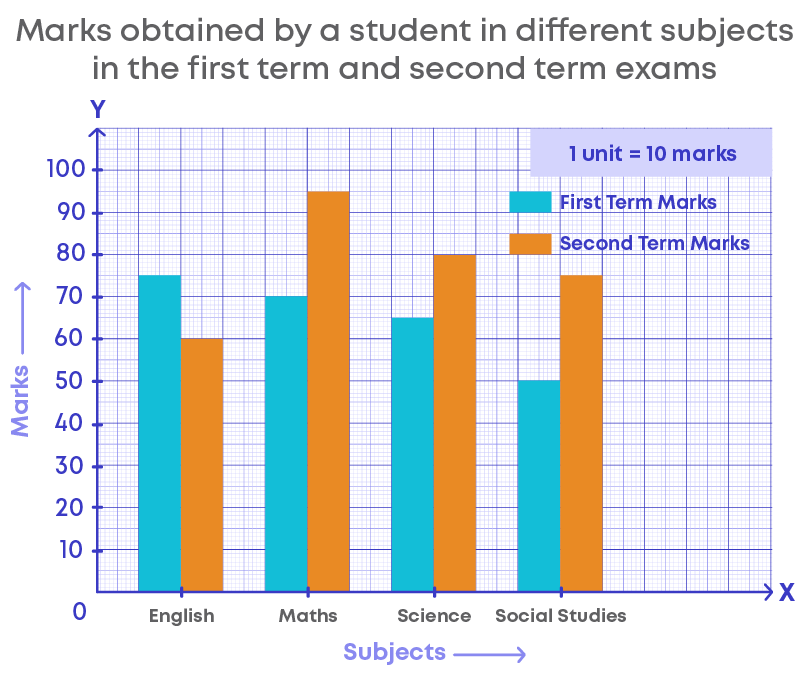
The following table shows the marks obtained by a student in different subjects in the first term and the second term examination.
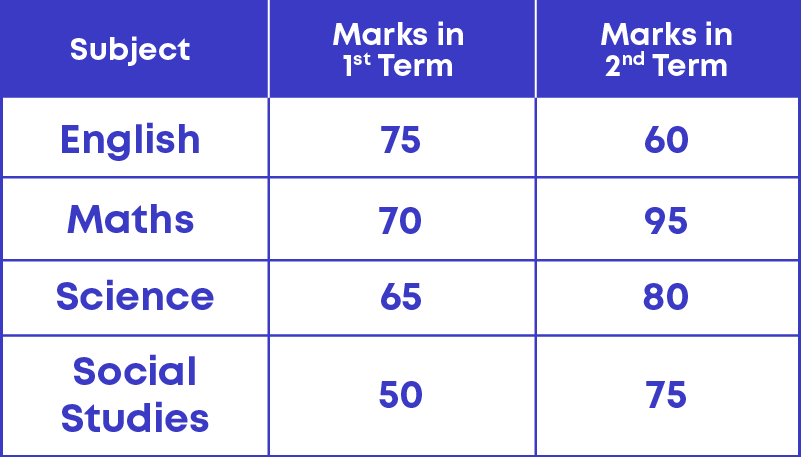
The graph below represents the given data:
Chance and Probability
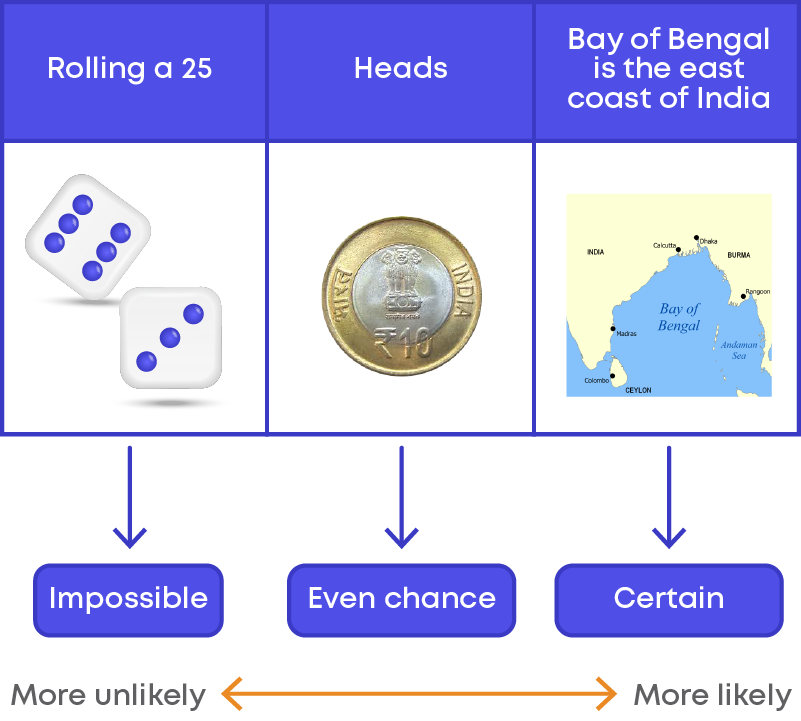
There are some events which are impossible to occur. These are called impossible events. For e.g., the sun rising in the west is an impossible event.
There are some events that will occur for sure. The events that will occur for sure are called certain events. E.g., if you are 14 years old now, you will be 15 next year.
There are some events which can happen or cannot happen. Both happening and not happening of the event is possible. E.g., India winning in the next football match. In this example, India might win the match or lose the match. We cannot say whether India will win or lose. Both, winning and losing the match are possible.
From the previous examples, we can see that there are some events which can happen and some events which will never happen. Let us understand more about events.
You are in a science lab conducting an experiment. At the end of the experiment, you will get a result. What just happened? An experiment has been conducted, that is, an event has occurred. The result of the experiment is called the outcome. For e.g., if you toss a coin, the result will be:
Head or Tail
Probability is the possibility of something happening or not happening. In other words, calculating the chance of occurrence (or happening) of an event is called probability.
We represent probability using the letter ‘P’.
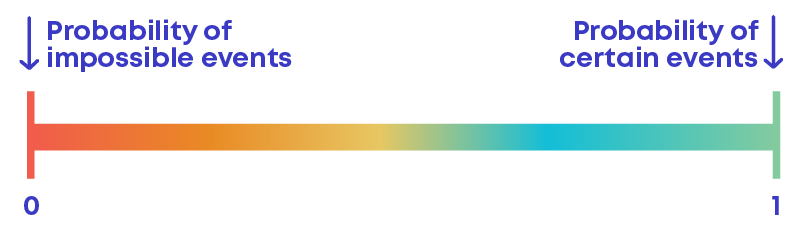
Probability of an event always lies between 0 and 1.
We have understood that there are some events that may happen or may not happen. For e.g., ‘Indian winning the next match.’
India may win the match or may not win the match. Hence, India winning the match is uncertain.
Even though India winning a match is uncertain, we can predict the chance of winning the game by the past performance. In the last 10 matches, India won 8 times and lost 2 times. So,
is there a better chance to win or lose? There is a better chance to win. Can we calculate the chance of winning using numbers? Yes.
- Calculating the chance of occurrence (or happening) of an event is called probability.
- In simple terms, in Maths, the chance (happening or not happening) of an event is called the probability of an event.
An outcome is a possible result of an event occurring. For example, when you flip a coin, “head” is one outcome; ''tail'' is the second outcome. Hence, the total number of possible outcomes is 2. A die has 6 faces, so when you throw a dice, there will be 6 possible outcomes.
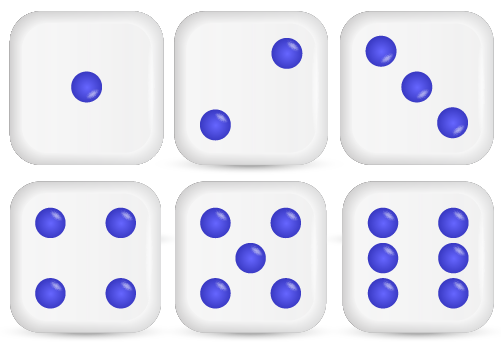
Hence, the total number of possible outcomes is 6.
A favourable outcome is an outcome or result that you are looking for in an experiment. Examples:
- When you toss a coin to get a head
There are only 2 outcomes, head and tail. Here you desire to get a head. So, the favourable outcome is head. Hence, the total number of favourable outcomes is 1.

The total number of possible outcomes is 2, out of that favourable outcome is 1. So, Probability of getting a head = 1/2
- When you roll a dice to get an even number
We know that a dice has 6 faces, hence, there are 6 possible outcomes: 1, 2, 3, 4, 5, 6
Here you desire to get an even number. Out of the 6 possible outcomes, only three of them are even numbers.
The favourable outcomes are 2, 4, 6.
Here, the total number of favourable outcomes is 3.
We use the following formula to find the probability of an event:

Common Errors
The following are topics in which students make common mistakes when dealing with symmetry:
- 1. Data set can have more than one mode
- 2. Arrange the data in ascending or descending order to find the median
- 3. Median when the number of observations is even
Data Set Can Have More Than One Mode
While calculating mode for data set, if two numbers are repeated same number of times, both the numbers will be the mode of the given data set.
For example: 3, 4, 6, 5, 4, 3, 7, 4, 3, 5, 6, 5, 5, 3
In the given data set, the numbers 3 and 5 occur 4 times, hence, the mode of the given data set is 3 and 5.
Arrange The Data In Ascending Or Descending Order To Find The Median
While calculating the median for a data set, the first important step is to arrange the data in ascending or descending order. Then find the median. If the observations are not arranged in ascending or descending order, we will get the wrong median of the given data set.
For example: 3, 4, 6, 2, 9, 11, 7
To find the median of the data set, let us arrange the observation in ascending order:
2, 3, 4, 6, 7, 9, 11
Median When The Number Of Observations Is Even
When the number of observations is even, then the median of the given data set is the mean of the two middlemost numbers.
For example: 3, 4, 6, 9, 11, 7
To find the median of the data set, let us arrange the observations in ascending order:
3, 4, 6, 7, 9, 11
Here the number of observations is even.
Conclusion
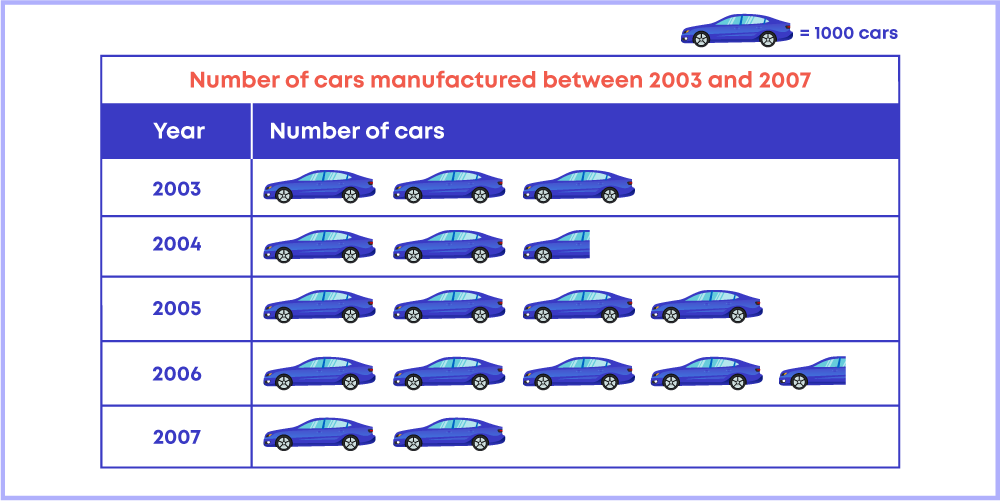
Data handling is a useful concept in day-to-day life. Can you solve this riddle based on data handling?
Observe the pictograph below and find the average number of cars sold during 2003 - 2007.

Arpana
Author
Arpana is an education specialist with years of teaching Math and developing content. She previously worked as a freelance content developer, developing lesson plans for a reputed publisher of text books and content for various educational companies. She is an enthusiastic teacher who has taught students from India, the UK, and New Zealand.