Introduction
What is probability? Let us watch this video to know.
In the examples discussed in the video, we used the words ‘probably’, ‘most probably’, ‘chances’, etc., which is the element of uncertainty. For example,
‘Probably, it will rain’ means it may rain or may not rain.
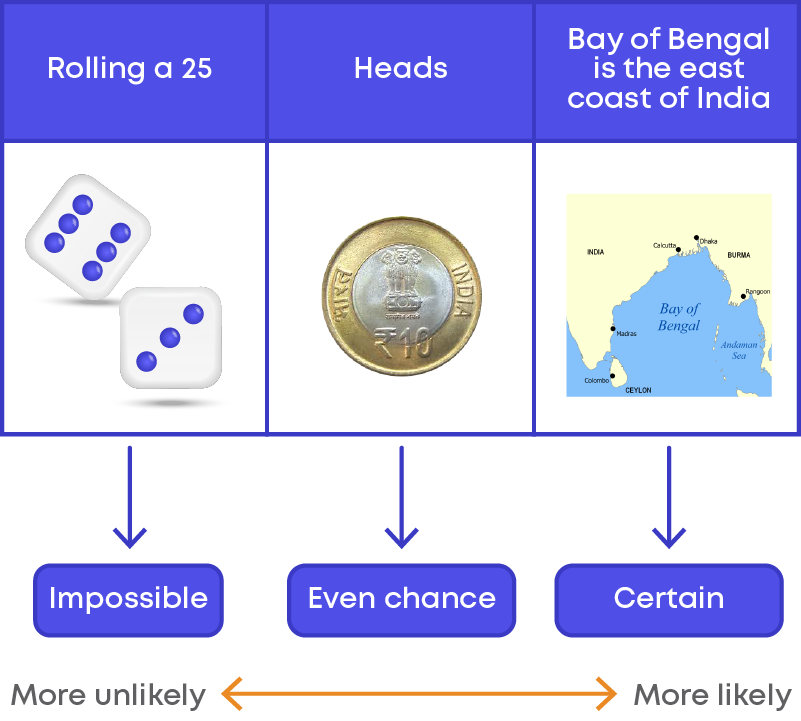
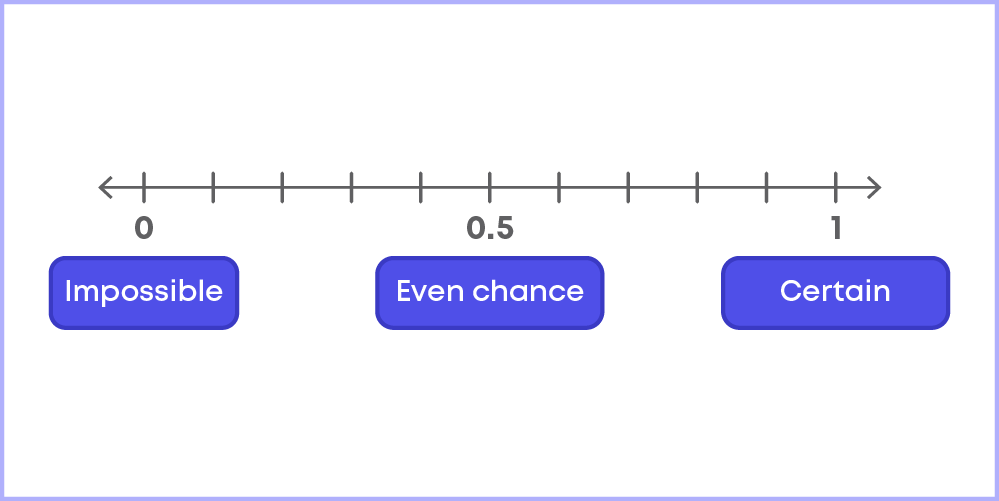
We are predicting that it may rain today based on our experience when it rained under similar conditions. We measure the uncertainty using ‘probability’. Based on this, we can have events which are certain to occur, events which have an even chance of occurring and some impossible events.
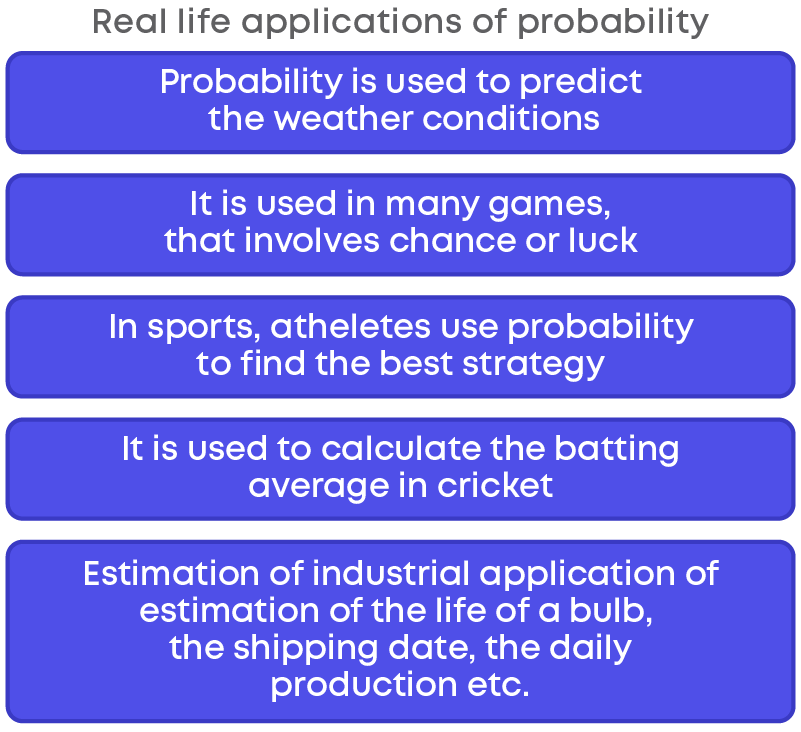
The chart below depicts this on a scale from more likely to more unlikely.
You can use probability to determine whether you will win or lose against your friend in board games, card games, video games, etc. which involve luck or chance. For example, look at the snakes and ladders board below:
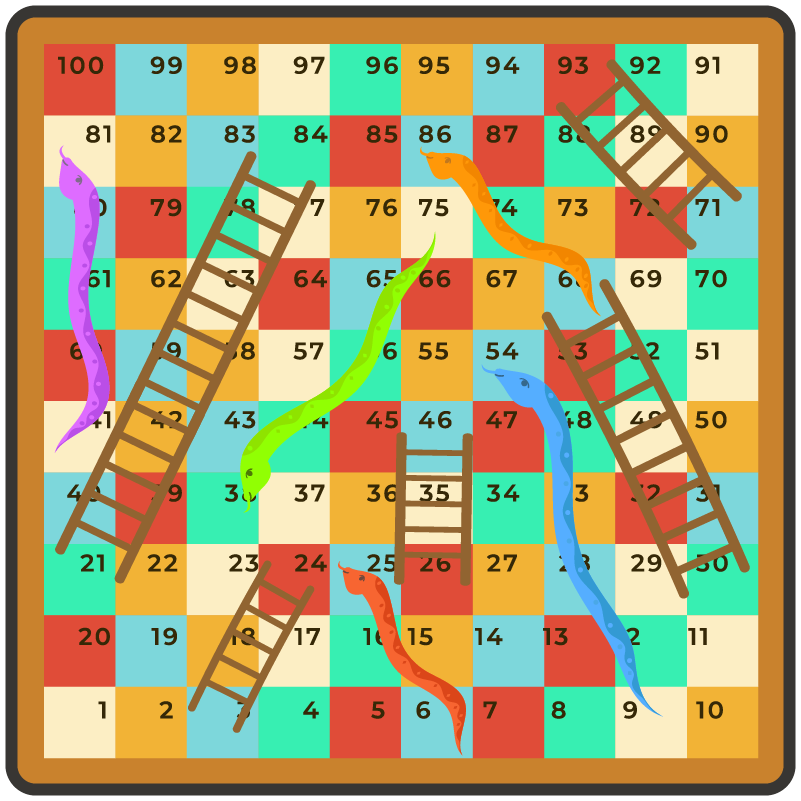
There are 100 squares, 5 snakes, and 5 ladders. You can easily calculate the probability of you landing on a snake as 5 100 . This means that there are 5 chances of you landing on a snake.
Probability mainly started with gambling, but now it is used in many fields like physical sciences, commerce, biological sciences, medical sciences, weather forecasting, etc.
Sub Concepts
The chapter ‘Probability’ covers the following sub concepts:
Understand What Is Probability
You must have heard these often:
- It is probably going to rain today.
- It could be sunny tomorrow.
- There is a chance of increase in the price of petrol.
Here we are not sure of the occurrence of the events. Thus, we use probability to tell the possibility of these events occurring or not occurring.
Can a dog fly? What type of an event is it? A dog cannot fly, it is an impossible event. So, the probability of a dog flying is zero.
Camel walks both on deserts and roads. What kind of event is it? It is a possible event.
In Mahabharat, a game of dice was played between the Kauravas and Pandavas. Shakuni, a cunning and wicked man was supporting the Kauravas. He had a magical dice that obeyed him. Whatever number he wished for would appear on the faces of the dice. Such dice are examples of biased dice.
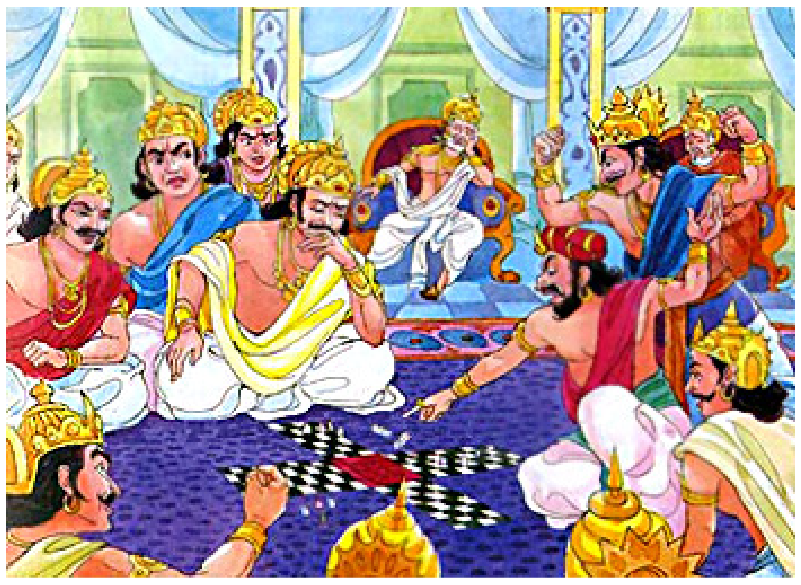
Using these biased dice the Kauravas won the game and sent the Pandavas to the forest.
Let us consider another situation to understand unbiased dice. Rahul and Sitara were playing ludo, using a die with six faces with 1, 2, 3, 4, 5, and 6 dots on them.

Rahul won the match. This was a fair game and Rahul and Sitara did not cheat each other. Hence, the die used for this play was a fair and an unbiased die.
What are the chances that when you roll some dice you will get a natural number?
1, 2, 3, 4, 5, and 6 dots are marked on the faces of a die.
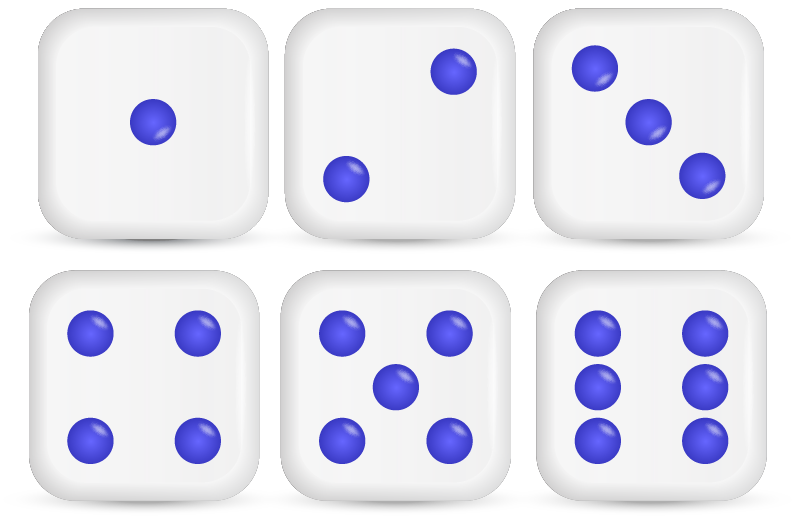
When we throw a die, we can get any of these numbers – 1, 2, 3, 4, 5, or 6. These are natural numbers. Hence, when you throw some die, you will for sure get a natural number. This is a certain event. So, the probability of getting a natural number when you roll a die is 1.
What can be the other outcomes when some die is thrown?
Do getting a 3 on the toss of a die and getting a 5 on the toss of a die have equal chances? Yes, there is an equal chance of getting 3 or 5 when a die is rolled. Thus, each numeral on a die is equally likely to occur when the die is tossed.
Possible Events
There are some events which are certainly going to happen. For example, in India, Republic Day is celebrated every year on 26th January.
Impossible Events
There are some events which cannot happen. Example: the sun rising in the west.
Understand the Terms Experiment, Random Experiment and Outcome of an Experiment
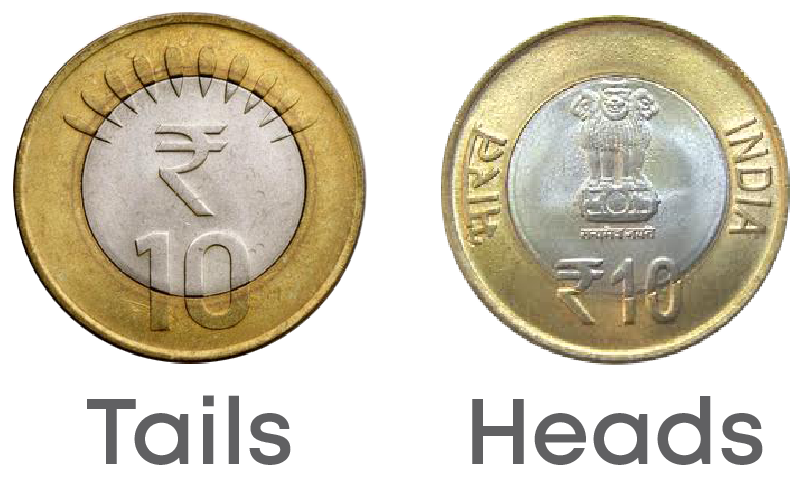
When a coin is tossed, the result is either a head or a tail. Tossing a coin is an operation. What do we call this operation? An operation which can produce outcomes is called an experiment. Performing an experiment is known as a trial. Here, the experiment is tossing a coin.
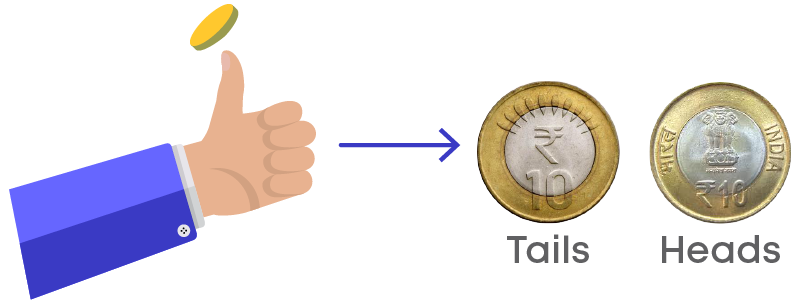
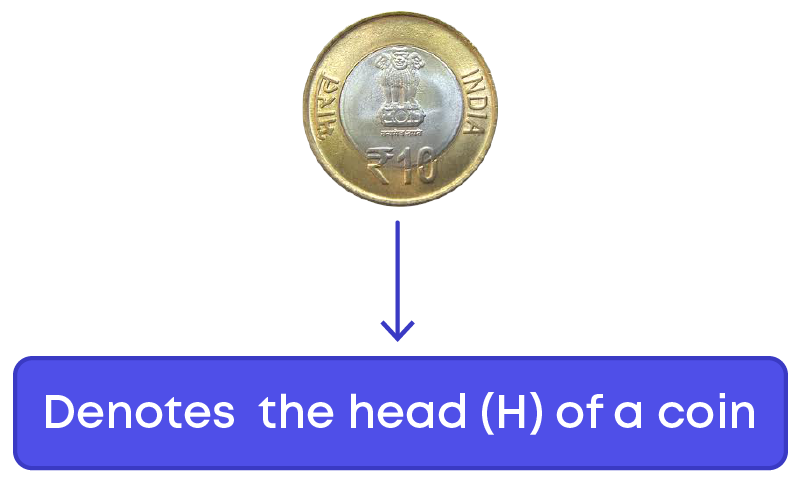
Getting a head in a particular throw is known as an event with outcome ‘head’.

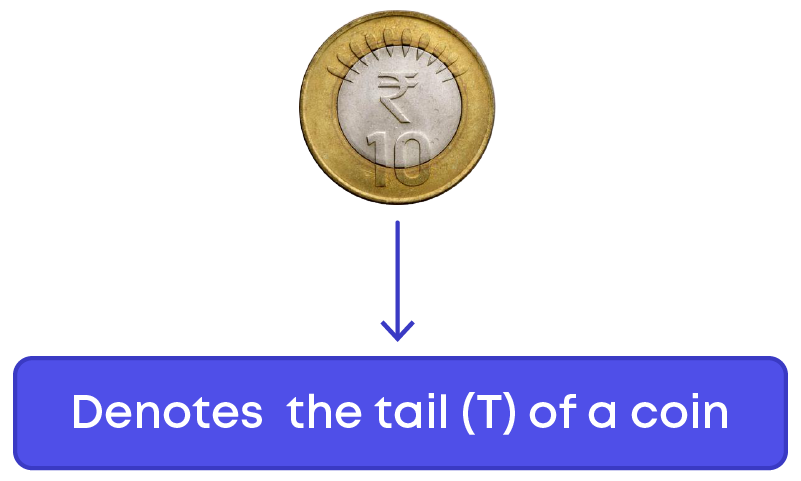
Getting a tail in a particular throw is known as an event with outcome ‘tail’.

Thus, each result of an experiment is called an outcome and a group of outcomes is called an event.
Probability is the measure of the possibility of an event occurring or not occurring.
Consider an example. A coin is tossed. What is the result we get? Maybe heads or tails. Here, the experiment is tossing the coin.
Every time we toss the coin, the result may vary. If the outcome of an experiment varies when repeated several times, it is called a random experiment. Can we predict the exact outcome when a coin is tossed? No. So, a random experiment is an experiment in which all possible outcomes are known, and the exact outcome of each trial cannot be predicted.
We know that when we toss a coin, the possible results will be either head or tail. The possible result is called an outcome. Now suppose a coin is tossed twice. The picture below shows the results.
Let us list the possible outcomes for each toss.
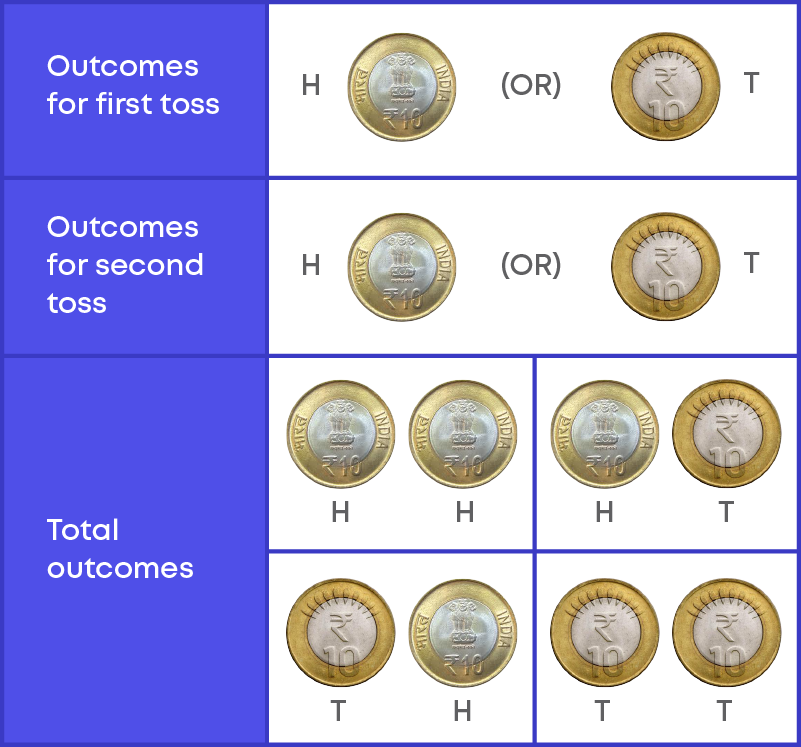
Thus, the outcomes when a coin is tossed twice are HH, HT, TH, TT.
When you roll a die, what are the outcomes you can get? A die has six faces. Hence, there are 6 outcomes - 1, 2, 3, 4, 5, and 6. Can we expect any other outcome from the experiment? No
Hence, the 6 outcomes are the only possible outcomes when we roll a die. A list of all the resulting possibilities of an experiment is called possible outcomes.
Ram is playing Ludo and he needs 6 as an outcome from the die to win it. When he rolls the die, the outcome is 6. The outcome is favourable to Ram. Favourable outcome is the outcome that you are looking for in an experiment.
Find the (Empirical) Probability of an Event
If you toss a coin, then the possible outcomes are either head or tail. The total possible outcomes are {Head, Tail}, which means the total number of possible outcomes are 2.
What is the chance of getting a head? For every toss, both head and tail have equal chances of occurring. Out of the total outcomes, head or tail can occur once. By this we can say that the probability of getting Head is 1 out of 2 possible outcomes. Similarly, the probability of getting tail is 1 out of 2 possible outcomes. This can be calculated as:

Hence, we can say,
Probability of getting a head = 1 2
Probability of getting a tail = 1 2
So, you see that the chances of each event occurring is equal.
There are some situations where the possible outcomes may not have equal chances of occurring.
There are 4 balls in a bag, out of which 3 are blue and 1 is red. Let the balls be A, B, C and D.
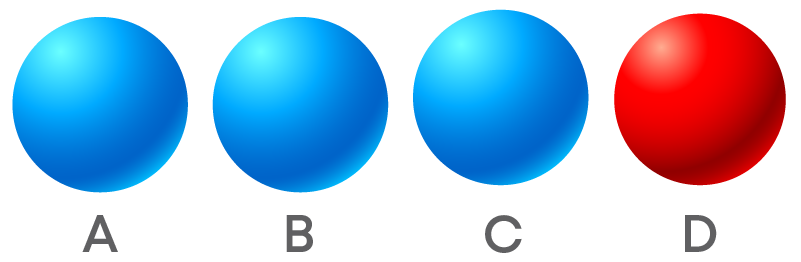
When you pick a ball, you have a chance of picking any one of the four balls. Here in the bag, there are 4 balls, so there is an equal chance that you might pick either ball A, ball B, ball C, or ball D.
Thus, the total number of possible outcomes will be [A, B, C, D], i.e., there are 4 possible outcomes.
If you pick one ball randomly what is the chance of getting a blue ball? Out of the 4 balls, there are 3 blue balls. So, there is an equal chance that you will pick any of the blue balls. That is, you might pick ball A, ball B or ball C (which are blue in color).
Hence, the favourable outcomes will be [ ball A, ball B, ball C], that is there are three favourable outcomes. So, the probability of picking a blue ball will be,
Probability of picking a blue ball = 3 4
This can also be represented as,
P (picking a blue ball) = 3 4
Now let us consider an example and understand that probability of an event lies between 0 and 1. When the dice is rolled,
- Getting a natural number is a sure event.
So, the probability of getting a natural number is 1. Hence, the probability of a sure event is always 1.
- Number of favourable outcomes of getting 8 is 0.
So, the probability of getting 8 is an impossible event. Hence, the probability of an impossible event is 0.
Consider the probability of
(1) Getting 1 is 1 6
(2) Getting a multiple of 2 is 3 6 or 1 2
(3) Getting a number greater than 4 is 2 6 or 1 3
From these, we can see that the probability of an event lies between 0 and 1. Also, probability of impossible events is 0 and that of certain events is 1.
Now consider the tossing of a coin. The possible outcomes are {Head, Tail}
Probability of getting a head: p(H) = 1 2
Probability of getting a tail: p(T) = 1 2
Let us add these probabilities:
Sum of the probabilities
= 1 2 + 1 2
= 1
Consider another experiment: Rolling a die
The possible outcomes are {1, 2, 3, 4, 5, 6}. The probability of getting any of the faces is 1 6 .
Sum of the probabilities = 1 6 + 1 6 + 1 6 + 1 6 + 1 6 + 1 6 = 6 6 = 1
Find the Probability of an Event by Reading a Frequency Distribution Table (Ungrouped Data)
To organise the data better we can arrange them in tabular form which is also called as frequency distribution table. What is frequency? Frequency is the number of times an event occurs. What is frequency distribution table?
For a particular event noting down the frequency and arranging them in a tabular column is called frequency distribution table.
Arrangement of data can be done in two ways.
- 1. Ungrouped
- 2. Grouped
What is ungrouped data?
Data arranged as individual or discrete data points. Example for an ungrouped data is,
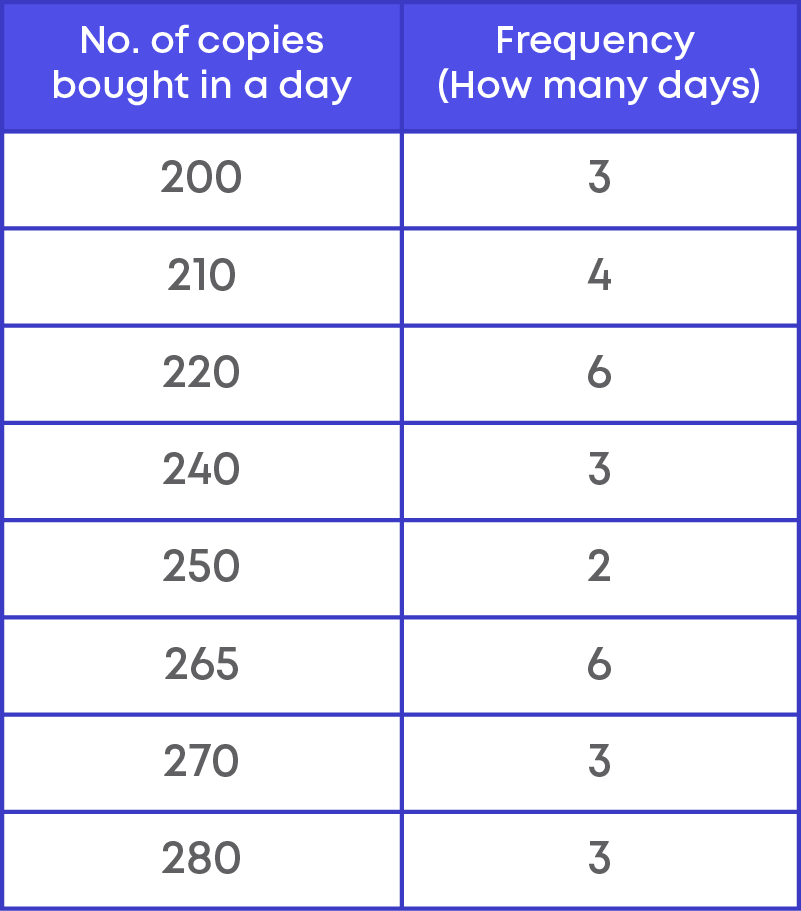
Observe the given data set below. It represents the number of copies of a magazine that is brought out by a particular publication on each day of a month. (The month has 30 days)
220, 210, 220, 265, 220, 265, 200, 200, 240, 210, 265, 220, 280, 265, 265, 280, 280, 220, 270, 210, 210, 240, 240, 250, 270, 270, 220, 250, 200, 265
Frequency distribution table for ungrouped data
In this section let us concentrate on ungrouped data and understand to find the probability of event given in the frequency distribution table of ungrouped data.
What is the total number of outcomes when a die is thrown once? The total number of outcomes are 6. Consider that when the die is thrown the outcome should be 3.
So, the probability of getting 3 is 1 6
Consider the table below which gives us the information of number of times each outcome has occurred when the dice is rolled for 10 times.
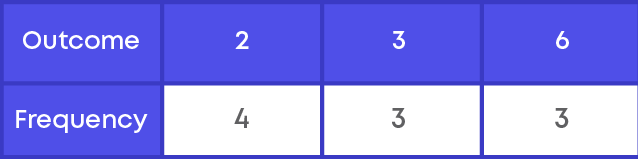
Here, frequency is the number of times of occurrence of an event.
(1) probability of getting 2 is 4 10 = 2 5
(2) probability of getting 3 is 3 10
(3) probability of getting 6 is 3 10
If the dice is thrown 500 times, how do we find the probability if there are different frequencies?
If the data is large, we can write it in a tabular column to understand the data and find the probability.
Let us consider that the die is thrown 500 times, and the frequencies of the outcome 1 is 75, 2 is 55, 3 is 60, 4 is 40, 5 is 100, and 6 is 170.
Let us arrange the number of outcomes and their frequency in tabular form.
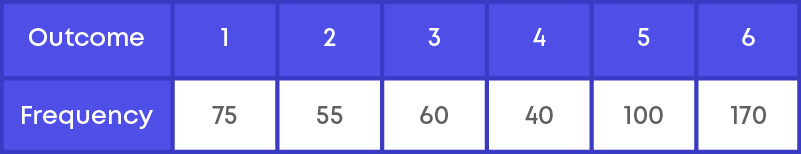
How do we calculate the probability of each outcome? We use the formula for probability, consider an outcome with its frequency, and calculate the probability.
Given that a die is being thrown 500 times with the observations given in the table below.
Let us find the probability of getting outcome 2 and outcome 4. Here, the total number of outcomes = 500. Favourable outcomes of getting 2 = 55.
Probability of getting outcome 2 is P (outcome 2) = 55 500 = 11 100
Favourable outcomes of getting 4 = 40.
Probability of getting outcome 4 is P (outcome 2) = 40 500 = 2 25
Find the Probability of an Event by Reading a Frequency Distribution Table (Grouped Data)
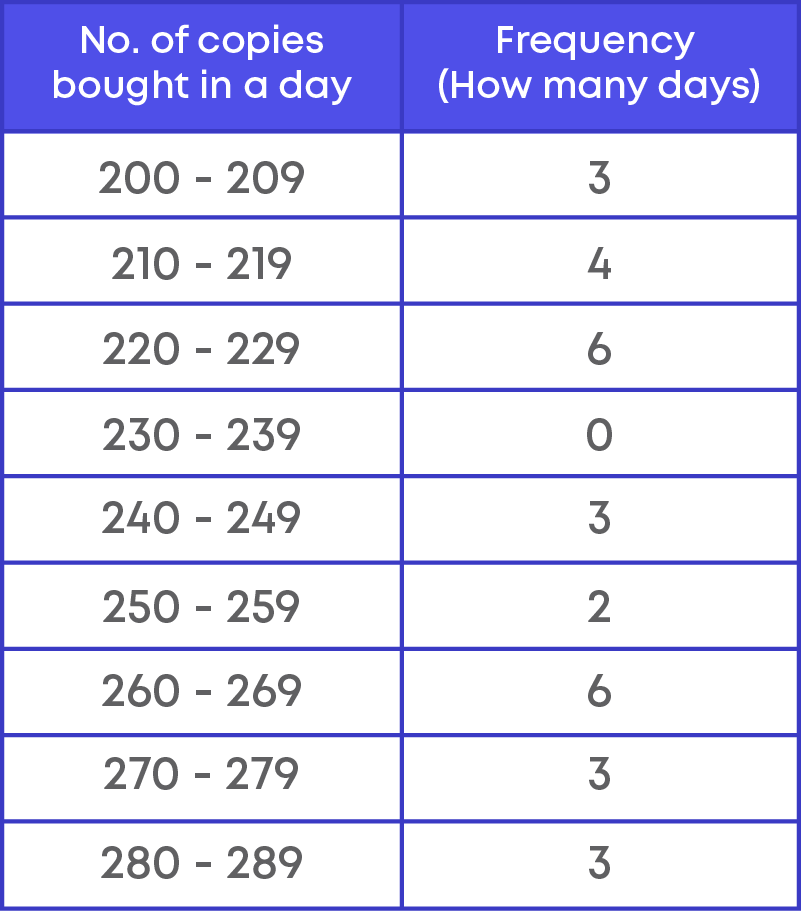
What are grouped data? Data arranged as intervals. Example:
Observe the given data set below. It represents the number of copies of a magazine that is brought out by a particular publication on each day of a month. (The month has 30 days)
220, 210, 220, 265, 220, 265, 200, 200, 240, 210, 265, 220, 280, 265, 265, 280, 280, 220, 270, 210, 210, 240, 240, 250, 270, 270, 220, 250, 200, 265
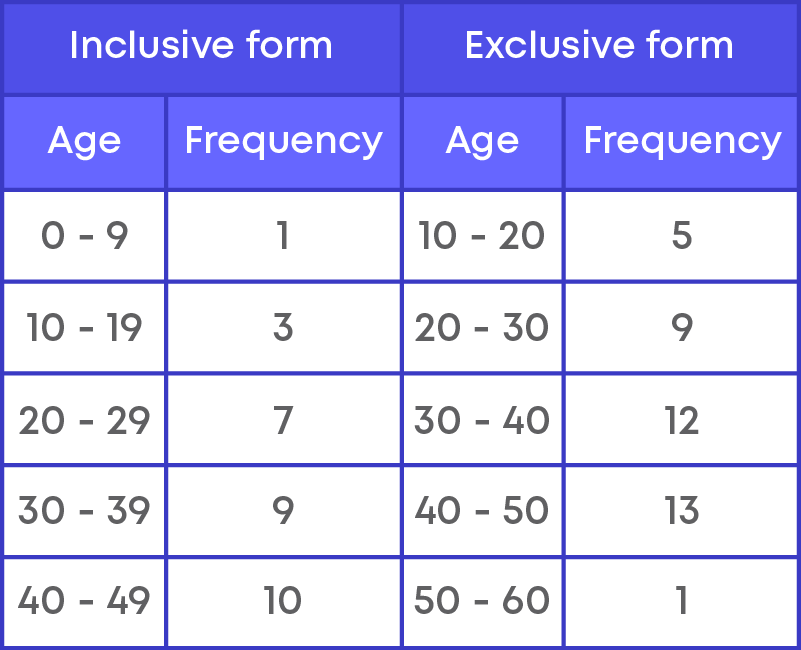
Frequency distribution table for grouped data,
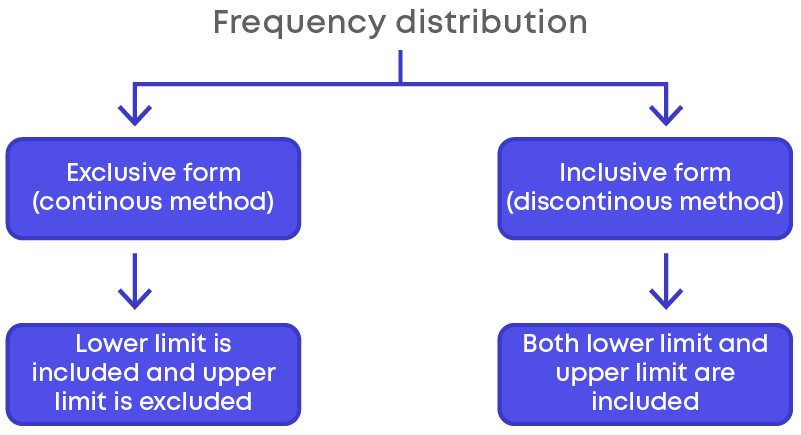
Grouped frequency distribution is divided into two forms.
For example, consider the data,
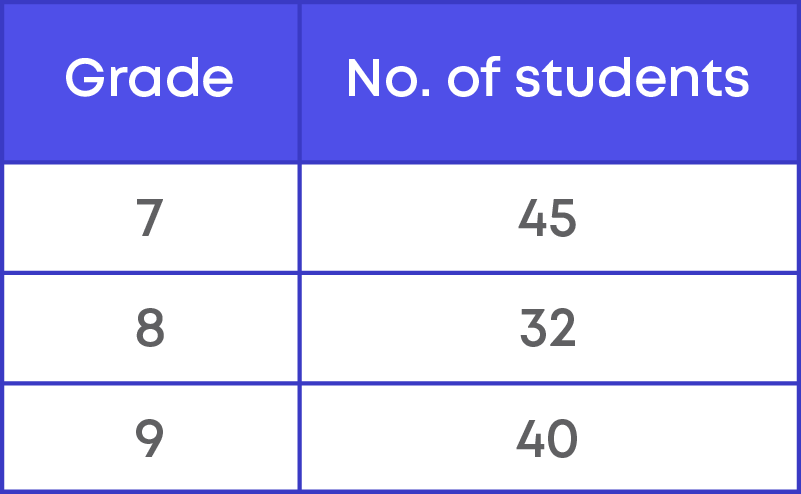
The marks obtained by 30 students in class 9 in an examination are given below:
3, 12, 15, 17, 25, 28, 24, 25, 29, 30, 38, 35, 37, 36, 39, 40, 48, 45, 47, 48, 48,
47, 48, 25, 28, 35, 34, 39, 45, 42.
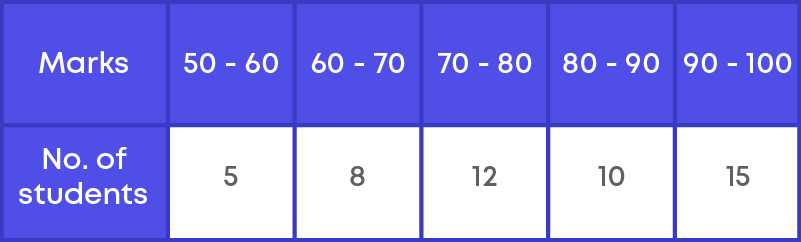
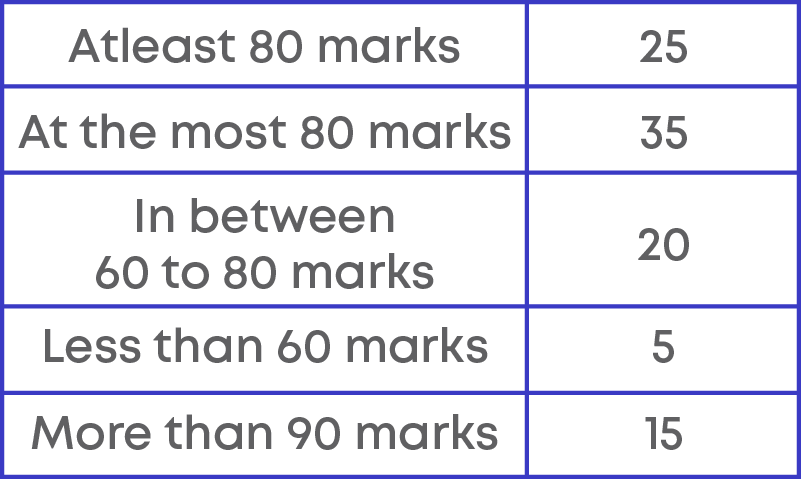
Let us understand the terms ‘at least’, ‘at the most’, ‘in between’, ‘less than’ and ‘more than’. Consider the marks obtained by 50 students between 50 to 100.
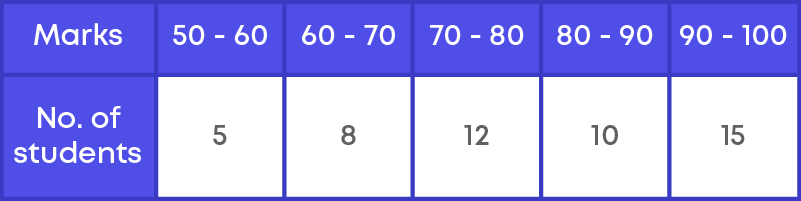
The class teacher prepares a table on students who scored,
At least 80 marks, at the most of 80 marks, in between 60 to 80 marks, less than 60 marks and more than 90 marks to present it to principal.
The table is prepared as shown below,
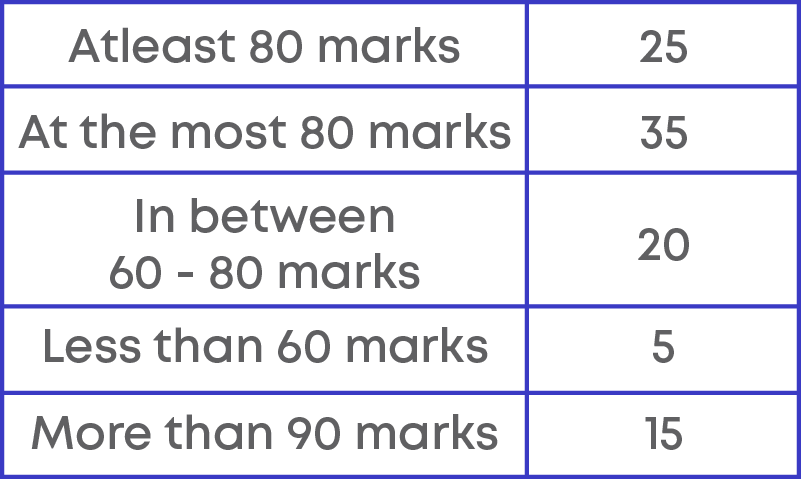
What is the meaning of 25 students scored at least 80 marks?
“At least means we need to consider the given number and more than the given number”. So, the number of students who score at least 80 marks is 12 + 10 + 15 = 37
What is the meaning of students scored at the most 80 marks?
“At the most means we need to consider the given number and less than the given number”. So, the number of students who scores at the most of 80 marks is 5 + 8 + 12 + 10 = 35
What is the meaning of students scored between 60 to 80 marks?
“Here we need to consider the marks between 60 and 80”. So, the number of students who scored between 60 to 80 is 8 + 12 = 20.
What is the meaning of students scored less than 60 marks?
“Here we need to consider the marks less than 60”. So, the number of students who scored less than 60 is 5.
What is the meaning of students scored more than 90 marks?
“Here we need to consider the marks more than 90”. So, the number of students who scored more than 90 is 15.
Now, let us learn how to find the probability of grouped data. Example:
Weights of students in a class is given below,
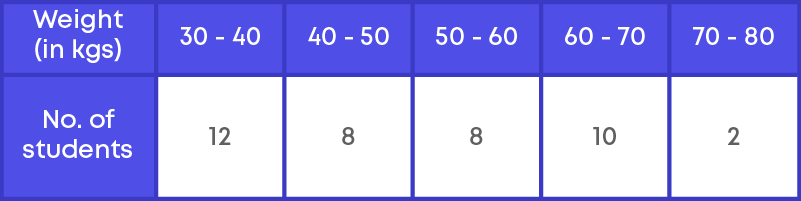
Here we used the exclusive form of a frequency distribution table.
(a) What is the probability that the weight of a student is at most 50 kg?
Total number of students is 40. Number of students whose weight is at most 50 kg means 50 kg or less. We must look at the frequencies of the classes 30 – 40 and 40 – 50 = 12 + 8 = 20.
Probability of weight of a student at most 50 kg is 20 40 = 1 5
(b) What is the probability that the weight of a student is at least 70 kg?
Total number of students is 40. Number of students whose weight is at least 70 kg means 70 kg and more than 70 kg. For this, we must look at the frequency of the class 70 – 80.
Frequency = 2
Probability that the weight of a student is at least 70 kg is 2 40 = 1 20 .
Common Errors
The following are topics in which students make common mistakes when dealing with probability:
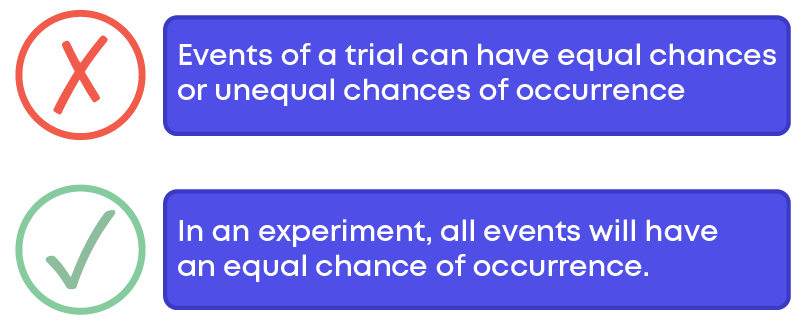
- 1. In probability, there is both equal and unequal chance of occurrence of an event in an experiment.
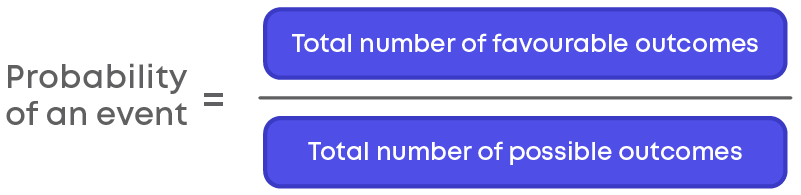
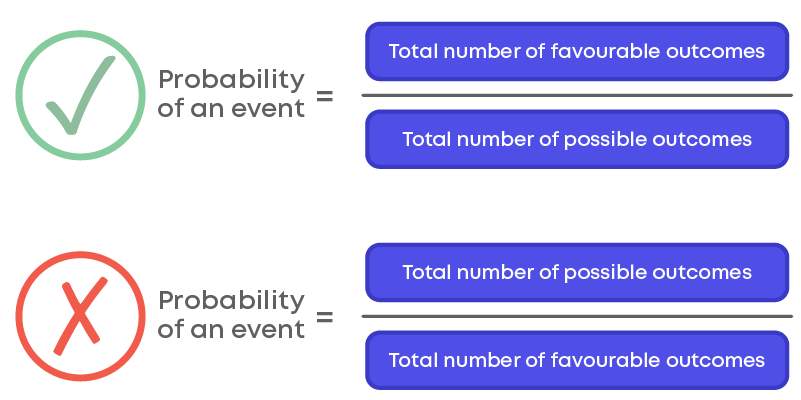
- 2. Formula - Probability of an event
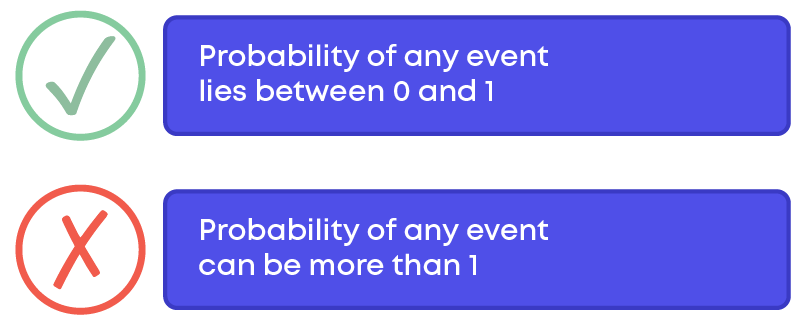
- 3. Probability of any event lying between 0 and 1
- 4. Terms that have to be understood to find the probability for grouped frequency data
In Probability, There Is Both Equal And Unequal Chance Of Occurrence Of An Event In An Experiment
Is there an equal chance of getting a 2 when you toss a die and getting a 6 when you toss the die? Yes, there is an equal chance of getting 2 or 6 when the dice is rolled. Thus, each numeral on a die is equally likely to occur when the die is tossed.
Let us consider another example:
There are 4 balls in a bag, out of which 3 are white and 1 is black.
Here, the chances of each event occurring is unequal, since:
Probability of picking a white ball = 3 4 and
Probability of picking a black ball = 1 4
Formula - Probability Of An Event
Formula to find the probability of an event,
Probability Of Any Event Lying Between 0 And 1
Consider another experiment:
The possible outcomes are {1, 2, 3, 4, 5, 6}. The probability of getting any of the faces is 1 6 .
Sum of the probabilities = 1 6 + 1 6 + 1 6 + 1 6 + 1 6 + 1 6 = 6 6 = 1

Probability of getting 8 is 8 6 = 4 3 = 1.333…
But number of possible outcomes of a die is 6. We cannot calculate probability for an outcome that is impossible. That is, the probability of getting 8 when a die is rolled is 0. Thus, we can say that probability of any event lies between 0 and 1.
Terms That Have To Be Understood To Find The Probability For Grouped Frequency Data
To find the probability of grouped data we come across terms like at most, at least, between, less than, and more than.
- At least: At least means we need to consider the frequency equal to the given number and frequencies more than the given number.
- At most: At the most means we need to consider the frequency equal to the given number and the frequencies less than the given number.
- Between: Consider the frequencies between the given numbers.
- Less than: Consider the frequencies less than the given numbers.
- More than: Consider the frequencies more than the given numbers.
Example:
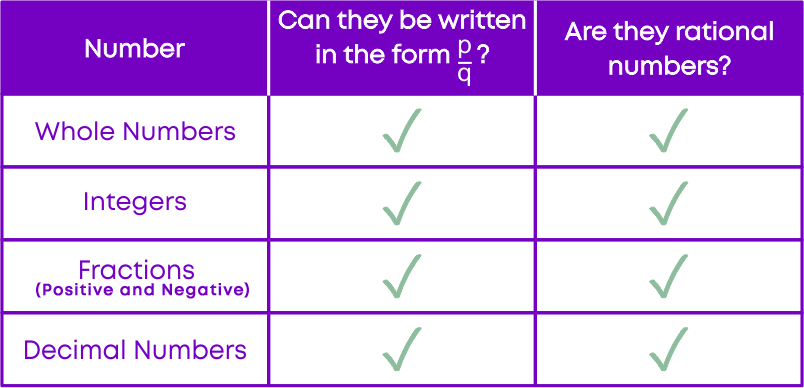
Conclusion
Can you solve this riddle based on probability?
The figure below shows where different types of events can lie on a scale.
How likely are the following events?
A) When a die is rolled, getting a number less than 7.
B) Drawing a black ball from a bag of green and red balls.
C) Getting an odd or an even number from a set of cards marked from 1 to 10.
Choose the scale which represents the positions of the events A, B and C correctly.

Arpana
Author
Arpana is an education specialist with years of teaching Math and developing content. She previously worked as a freelance content developer, developing lesson plans for a reputed publisher of text books and content for various educational companies. She is an enthusiastic teacher who has taught students from India, the UK, and New Zealand.